


a . Data-driven insights minimize guesswork, allowing leaders to make decisions based on concrete evidence.
b . Provides historical trends and real-time data to predict outcomes effectively.
a . Analyze market trends, customer behavior, and industry benchmarks to uncover new business opportunities.
b . Spot underperforming areas for improvement and allocate resources to high-performing sectors.

a . Leverage analytics to gain insights into customer preferences, pain points, and buying patterns.
b . Tailor products and services to meet customer needs, enhancing satisfaction and loyalty.
a . Use data to identify bottlenecks and inefficiencies in processes.
b . Optimize supply chain, inventory, and workforce management based on predictive analytics.

a. Stay ahead by analyzing competitor data and market trends.
b. Use benchmarking reports to position your business strategically.
a. Predict potential risks through data patterns, helping to mitigate financial or operational threats.
b. Generate scenarios and simulations to test the impact of decisions before implementation.
a. Track financial metrics, such as ROI, cash flow, and profitability, to ensure better fiscal management.
b. Create accurate forecasts for revenue and expenses using historical data.
a. Use dashboards and visual reports to make complex data easily interpretable for stakeholders.
b. Align teams with clear, actionable insights.
a. Analyze feedback and user behavior to innovate and refine product offerings.
b. Predict market demand for upcoming features or products.

a. Track business performance in real time through custom KPIs.
b. Align individual, team, and organizational goals for cohesive growth.
a. Assess campaign performance to optimize strategies and maximize returns.
b. Segment customer data to run personalized marketing campaigns.

a. Quickly adapt strategies in response to changing market dynamics.
b. Scale operations confidently with data-driven scalability plans.
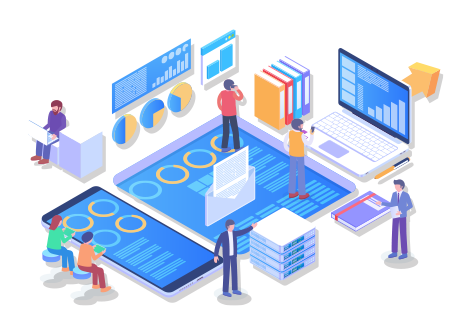
Make smarter, data-driven decisions with real-time analytics and customized reporting dashboards, designed to give you a comprehensive view of your operations

Collecting data from various sources such as databases, APIs, surveys, and IoT devices. Integrating structured and unstructured data ensures a comprehensive analysis that provides a full view of the business environment.

Cleaning data by removing duplicates, filling missing values, and standardizing formats. This step ensures the data is accurate and consistent, forming a solid foundation for analysis.
Applying various analytical techniques such as descriptive, diagnostic, predictive, and prescriptive analysis to derive insights from data. This helps identify patterns, reasons behind trends, forecast future outcomes, and recommend actions.
Automating the generation and distribution of reports, which streamlines the process and ensures real-time access to insights without manual intervention.
Utilizing platforms such as Power BI, Tableau, and Zoho Analytics to build, customize, and share interactive reports and dashboards across the organization.

Continuously refining analytical models and reports applying feedback and A/B testing to drive ongoing improvements in business strategies and performance.